
Sunday 12 September 2010
Illustration
Just got a Wacom Tablet, and Ive been playing with it today:
 I'm pretty happy with that, im going to upload it to teepay.
Monday 6 September 2010
Some other research i will post up
Soon, ive been here all day so im having a well earned rest
The Golden Black
PaleHorse Design
The Golden Black
PaleHorse Design

WALRUS by CAIDA
"Description
Walrus is a tool for interactively visualizing large directed graphs in three-dimensional space. It is technically possible to display graphs containing a million nodes or more, but visual clutter, occlusion, and other factors can diminish the effectiveness of Walrus as the number of nodes, or the degree of their connectivity, increases. Thus, in practice, Walrus is best suited to visualizing moderately sized graphs that are nearly trees. A graph with a few hundred thousand nodes and only a slightly greater number of links is likely to be comfortable to work with.Walrus computes its layout based on a user-supplied spanning tree. Because the specifics of the supplied spanning tree greatly affect the resulting display, it is crucial that the user supply a spanning tree that is both meaningful for the underlying data and appropriate for the desired insight. The prominence and orderliness that Walrus gives to the links in the spanning tree, in contrast to all other links, means that an arbitrarily chosen spanning tree may create a misleading or ineffective visualization. Ideally, the input graphs should be inherently hierarchical.
Walrus uses 3D hyperbolic geometry to display graphs under a fisheye-like distortion. At any moment, the amount of magnification, and thus the level of visible detail, varies across the display. This allows the user to examine the fine details of a small area while always having a view of the whole graph available as a frame of reference. Graphs are rendered inside a sphere that contains the Euclidean projection of 3D hyperbolic space. Points within the sphere are magnified according to their radial distance from the center. Objects near the center are magnified, while those near the boundary are shrunk. The amount of magnification decreases continuously and at an accelerated rate from the center to the boundary, until objects are reduced to zero size at the latter, which represents infinity. By bringing different parts of a graph to the magnified central region, the user can examine every part of the graph in detail.
Walrus is being developed by Young Hyun at CAIDA. Although Walrus is based on research by Tamara Munzner, she is not connected with this effort in any way, nor does Walrus make use of any code from her H3Viewer."
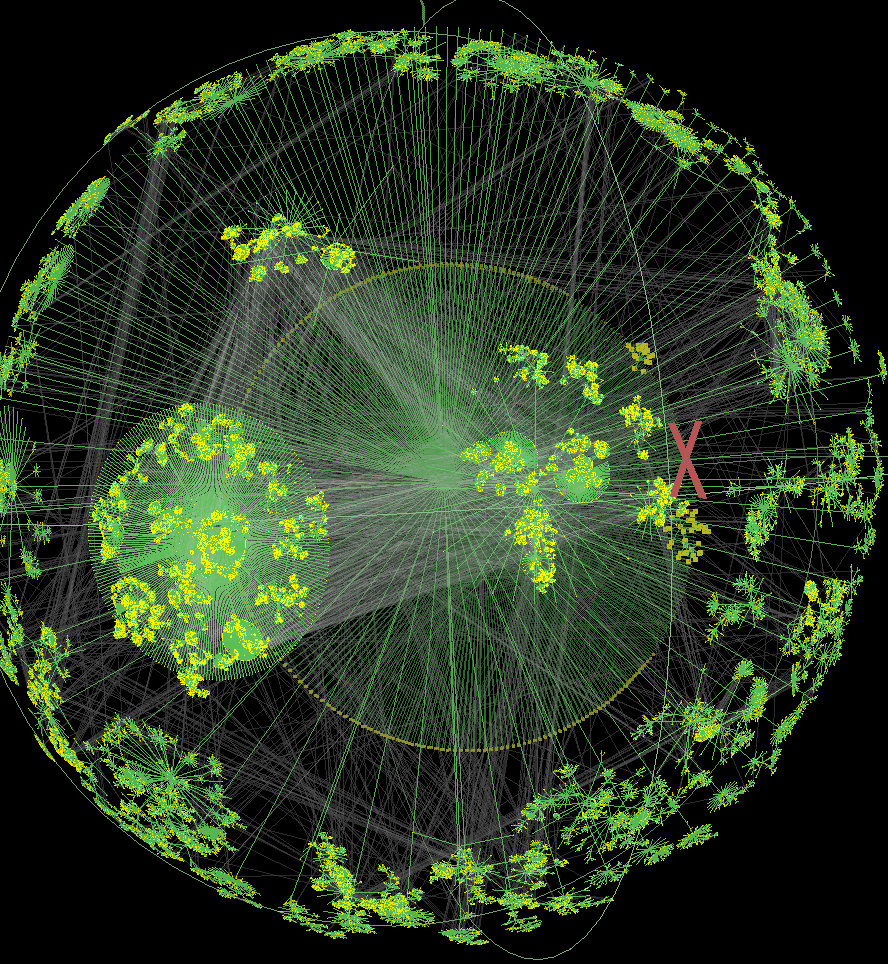


This is a datavis application by CAIDA called WALRUS. Theres a description above if youre interested, I just think the data visualisations produced here look really impressive, they dont look as great from a visual perspective close up. Its obvious that a hell of alot of information is used in conjunction with this software, but what drew my eye to it was the almost floral forms it creates with info alone.


David McCandless
Here is a data visualisation for the Guardian on the subject of time travel in T.v and Films. It's quite a tongue and cheek data vis, i like it because it is simple, but i bet figuring out how to map this wasnt all that simple...


Always With Honour - Space Debris
Quite a nice little Article about the constituents of space debris by Always With Honour. Simple but effective use of vector graphics and a spacey colour palette.
 Also Here is another one of Always With Honour's articles, a fun supplement called the peace atlas.
 The colour uniformity and the simplicity of the vectors really compliment the type here I think.


Subscribe to:
Posts (Atom)